The last 6-7 weeks have provided
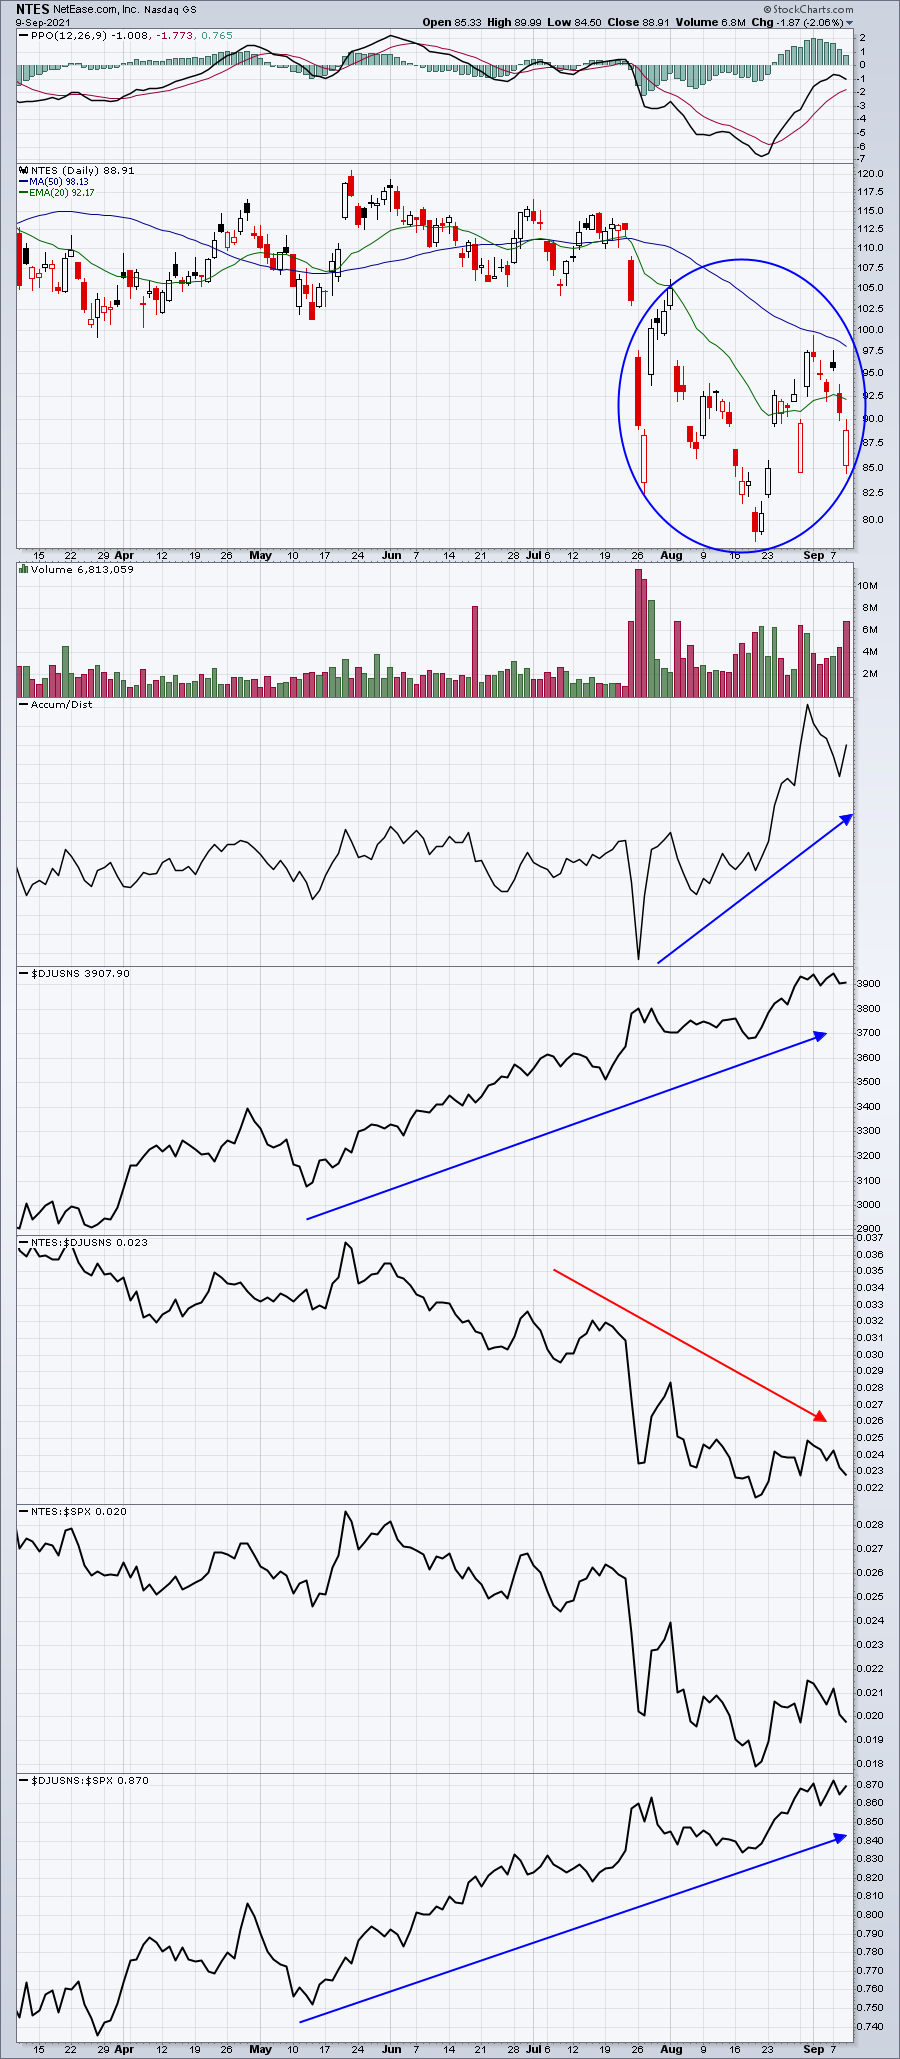
perhaps the most mixed messages I've ever seen on a chart. On one hand, we have a company that's in the red-hot internet space ($DJUSNS), but it's been a massive laggard within the group. That can easily be seen by reviewing the relative strength panel, where NTES vs. the DJUSNS has been declining at a fast and furious pace. That looks SO bearish. But then check out the AD line, which has been soaring and recently climbed to a 3 1/2 year high. The reason we're
seeing this is that there have literally been almost no filled candles (closes below opens). Instead, we're seeing almost all hollow candles (closes above opens) after big gaps lower. Look at that big blue circle on the price chart. With the exception of July 26th, most candles are either lengthy hollow or have relatively small candle bodies. There's been very little selling during the
day.
So what's the likely direction here.
Honestly, these two conflicting signals suggest it's a toss up to me. Flip a coin. However, if you look at a longer-term 5-year chart, you'll see that NTES is actually in a BIG PICTURE uptrend. Based on that, I believe these hollow candlesticks are very bullish and I eventually expect to see NTES surging higher again. Trying to determine whether that starts tomorrow, next week or next year, though, is the difficult question to
answer.