EarningsBeats.com Digest for July 19, 2021
|
Trading Places Live!
Join Tom Bowley for a briefing on market activity on Mondays and Wednesdays from 9-9:30 am EST before the opening bell. Click here to listen live or visit our YouTube page later today to view the recorded session.
Join Us for Two Big Webinars This Week:
Model ETF Portfolio
Today, July 19th at 5:00pm EST
About the event: EarningsBeats.com's Chief Market Strategist Tom Bowley will unveil the next batch of ETFs hand-selected to outperform the S&P 500. Tom will discuss his strategy in selecting and weighting the various ETFs to maximize their cumulative return.
Who can attend: This is an EarningsBeats members-only event. To sign up for a NO COST 30-day trial and receive access to this event, click below.
Q2 Earnings
Tuesday, July 20th at 4:30pm EST
About the event: Join Tom Bowley, EarningsBeats.com's Chief Market Strategist, as he points out the best quarterly earnings reports to date and then uses both absolute and relative strength indications to uncover those companies most likely to report blowout results throughout the balance of earnings season. This is a very popular quarterly event that you don't want to miss!
Who can attend: This is an EarningsBeats members-only event. To sign up for a NO COST 30-day trial and receive access to this event, click below.
Relative Weakness Suggests to Stay Away
Everyone would LOVE to know whether a company will beat or miss revenue and EPS estimates BEFORE the actual report comes out. For me, there is no such thing as a guarantee, but an EXCELLENT indication is how a company is performing relative to its peers as it approaches its earnings report. Wall Street makes choices every single day and when a company lags its peers, it's at least one indication that Wall Street is not impressed with a company's
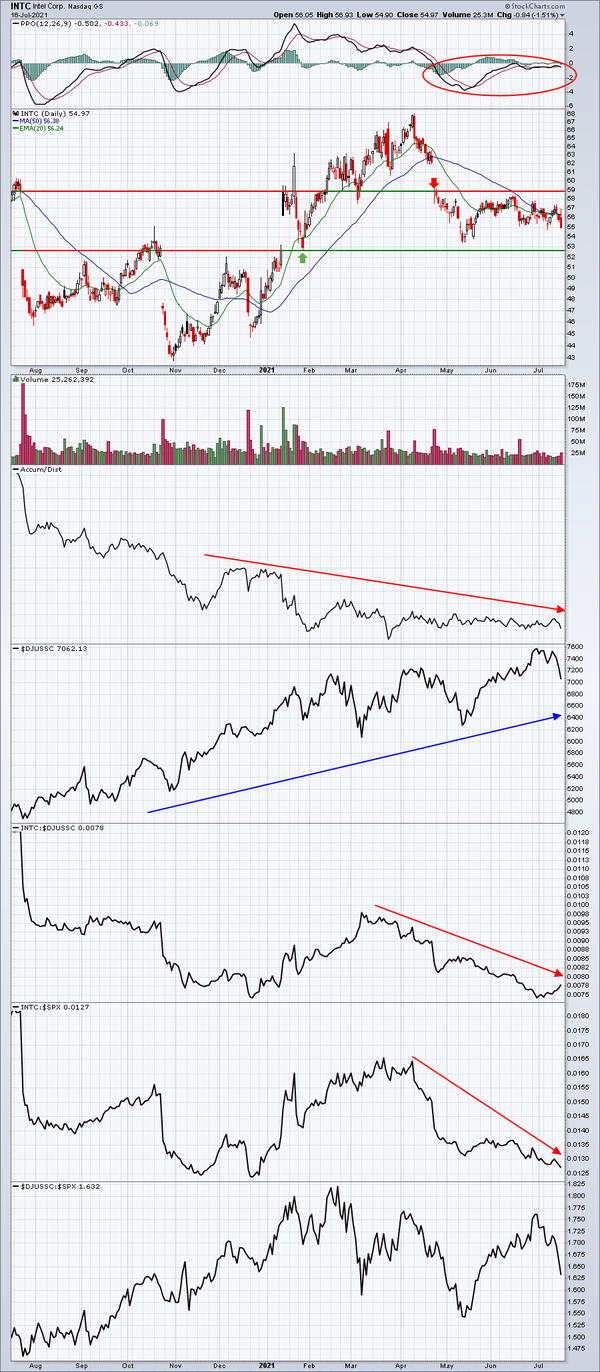
upcoming results. Intel Corp (INTC) is part of a semiconductor group that's been among the leaders in 2021, despite some relative weakness the past 2-3 weeks. INTC, though, has been weak among its peers:
A couple of key gaps on its chart suggests a current price range from 52.60-58.80, so let's see which way the chart breaks eventually. For now, however, I'd be a bit bearish on INTC as its daily PPO remains negative, its AD line is close to a 52-week low, and INTC's relative strength vs. semiconductors remains in a downtrend. Perhaps the INTC:$DJUSSC ratio has double-bottomed, testing the relative low from late 2021. That would be one possible
positive technically, but if that relative support is lost, it could be awhile before INTC shows the necessary relative strength to consider it as a possible investment opportunity.
Happy trading!
Tom Bowley
Chief Market Strategist
EarningsBeats.com
Better Timing. Better Trades.
|
|
|