EarningsBeats.com Digest for June 30, 2021
|
Trading Places Live!
Join Tom Bowley for a briefing on market activity on Mondays and Wednesdays from 9-9:30 am EST before the opening bell. Click here to listen live or visit our YouTube page later today to view the recorded session.
What's In A ChartList?
At EarningsBeats, we use our research to develop ChartLists that provide our members with high reward-to-risk trading and investing candidates on demand. Click below to learn more about the lists we offer.
Like what you see? Consider joining us for a NO COST 30-day trial and receive access to our Member Onboarding webinar on Thursday, July 1st at 4:30pm eastern. See you there!
Case Study: Carving Out A Bottom
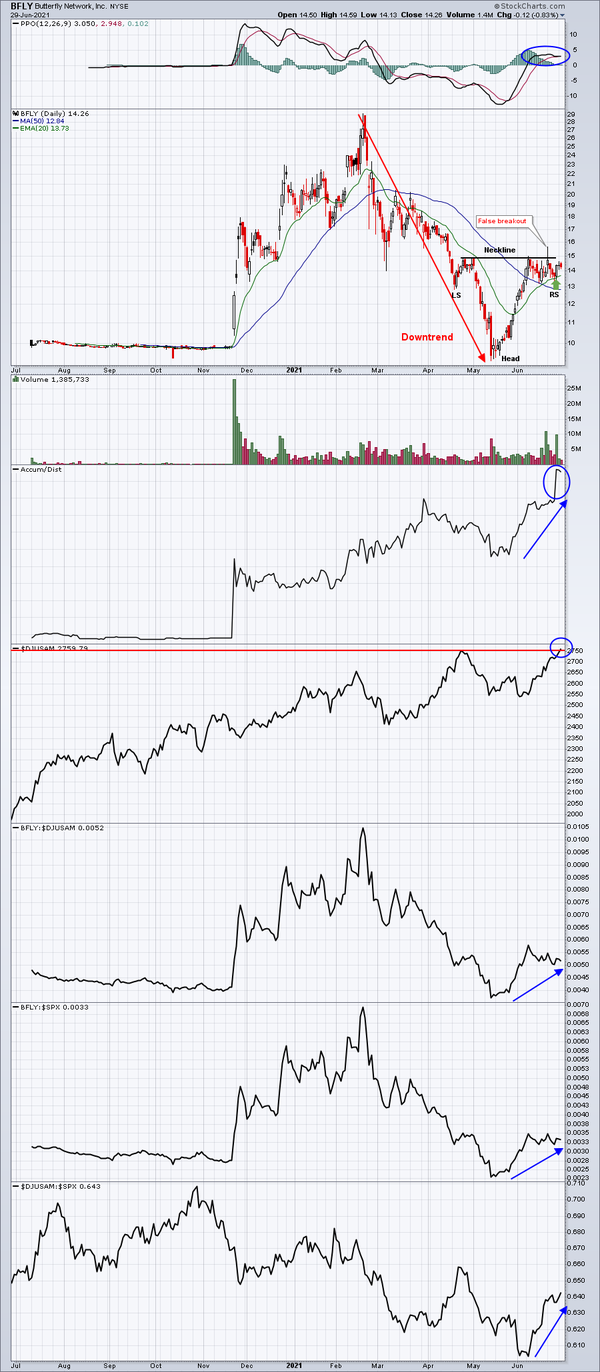
Technical patterns never provide us any guarantees, but they do suggest probabilities. Any time that I see the likelihood of a bottom in a secular bull market, I get excited. The big picture indicates that most stocks are going to move higher, so a stock that also provides technical clues of a bottom definitely grabs my attention. Enter Butterfly Network (BFLY), a $2.73 billion medical device company:
I see a bottoming reverse head & shoulders pattern. To the downside, the pattern could be negated by a close back beneath the 50-day SMA, currently at 12.84. That would also clear the left shoulder low at 12.87, so be careful if that's lost. Otherwise, I see extremely bullish short-term developments here. The daily PPO is clearly showing bullish momentum and after the recent failed breakout attempt, a classic 20-day EMA test was
successful (green arrow). A break above 14.88 on a closing basis would measure to approximately 20.50. That would challenge the March 11th reaction high of 20.39. This move higher could happen very quickly as the drop from 20 to sub-10 occurred in just two months.
Happy trading!
Tom Bowley
Chief Market Strategist
EarningsBeats.com
Better Timing. Better Trades.
|
|
|