EarningsBeats.com Digest for June 11, 2021
|
Save The Date!
Webinar: Monthly Max Pain
Tuesday, June 15th, 2021 at 4:30pm eastern
Details to follow.
The Art of Selling High and Buying Back Cheaper
Technical analysis provides us warning signals of short-term tops and we can use them to our advantage as short-term traders. I've written about this before, so this shouldn't be new to those who regularly follow me at EarningsBeats.com as a member, here on the EB Digest newsletter, and/or at my blogs at StockCharts.com. Reversing candles and negative divergences provide useful short-term warnings. They're not always right, so please take this
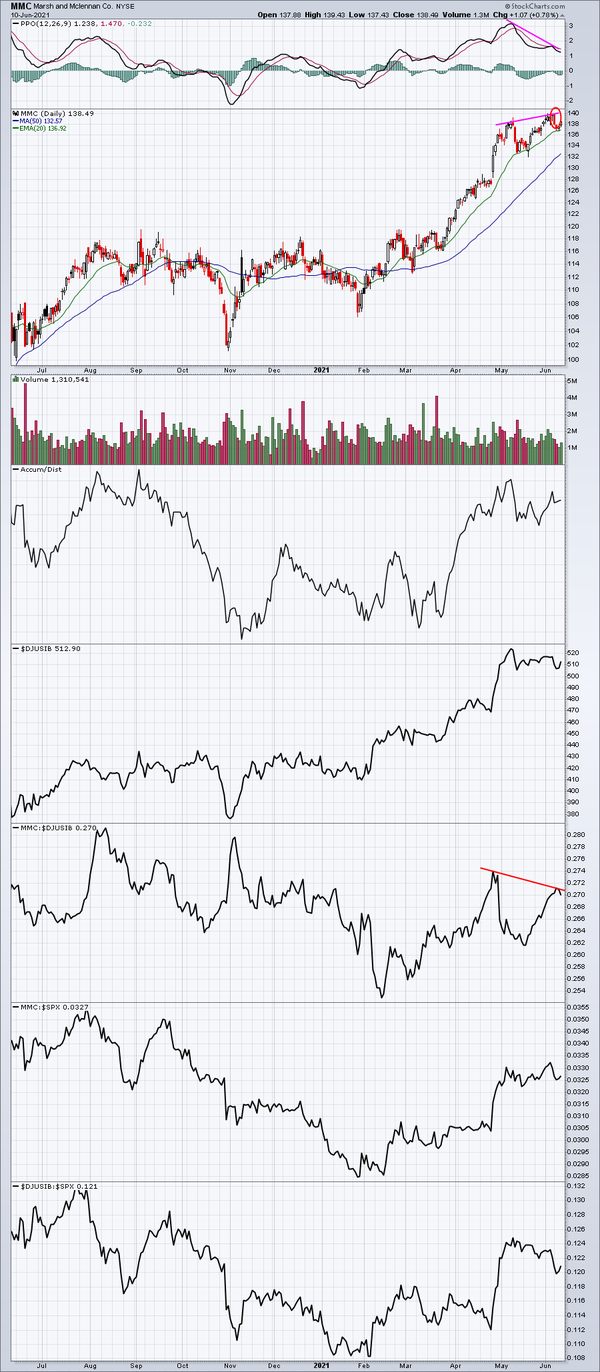
for what it's worth. This combination simply provides us a warning that the risk of a turn lower is increasing. Given this, let's look at Marsh and Mclennan Co (MMC), which is showing us certain warning signs:
The most recent price high was accompanied by a nasty negative divergence. The red circle highlights the bearish engulfing candle that printed simultaneously. Looking below in the additional relative strength panels you'll find that MMC's relative strength vs. its insurance broker peers ($DJUSIB) has deteriorated on its two most recent price highs. That would be enough to tell me to take profits if I owned it and wait for a better re-entry
price, possibly a 50-day SMA test. That would serve two purposes. First, it would quite possibly save me from a drop of 5 bucks to test the 50-day SMA. But equally important, or perhaps more important, is the fact that I'd free up cash and be able to look for a better reward-to-risk trade.
Happy trading!
Tom Bowley
Chief Market Strategist
EarningsBeats.com
Better Timing. Better Trades.
|
|
|