Daily Market Report
Thursday, June 10th, 2021
Just a quick reminder that our Spring Special, our best annual deal of the year, ends less than one week from today on Tuesday, June 15th. The annual special provides 14 months of membership (two bonus months!) for $997, 52% off the regular monthly rate of $147. For more information, CLICK HERE!
- Futures were quite volatile after the May CPI was released
- After a brief period of selling in pre-market, our major indices rebounded and opened higher, despite the higher inflation numbers
- The S&P 500 hit an all-time intraday high at 4249.74 before filling its gap back to Wednesday's close
- Our key indices are rebounding again, as I write this, with the NASDAQ the leading index
- Health care (XLV, +1.42%) is the undisputed new leader currently as the market continues to rotate; the XLV has a history of leading during June
- Biotechs ($DJUSBT, +1.53%) are extending their recent breakout and strength, though pharmaceuticals ($DJUSPR, +2.03%) are the best industry group in the sector
- Most S&P 500 leaders today reside in the health care area, including Biogen (BIIB, +3.81%), which has been on a tear to the upside
Well, we saw the latest CPI report this morning and it confirmed exactly what I've been discussing. The headline CPI number was the highest we've seen in many, many years. Yet, after a quick negative reaction in pre-market, our major indices popped to the upside, with the S&P 500 printing an all-time intraday high. It must close above 4232.60 to print a closing high record. After an initial move higher in
the 10-year treasury yield ($TNX) this morning, that's settled back down and is currently flat. So with this multi-year high in inflation and some calling for hyper-inflation down the road, the bond market is yawning. It's certainly not the reaction that inflation backers were expecting I'm sure.
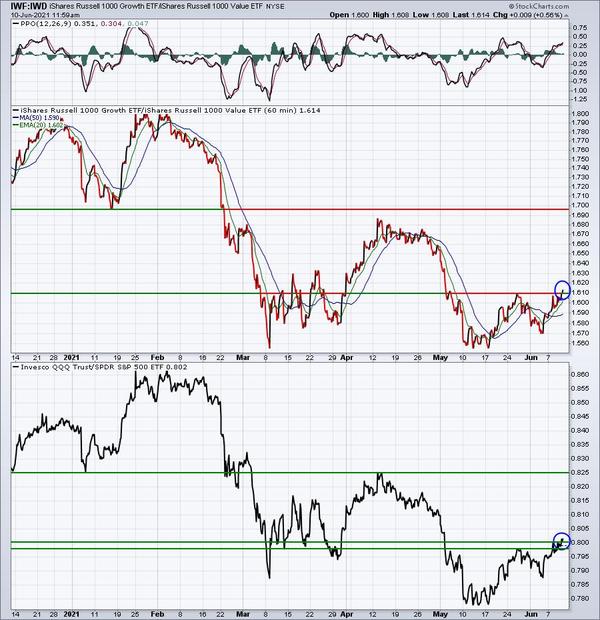
Another signal being sent this morning is that the growth stocks vs. value stocks ratio (IWF:IWD) may have bottomed at 1.54-1.55. We're still consolidating so I wouldn't say it's been confirmed, but watching today's reaction to a blistering-hot inflation number - the May Core CPI rose 0.7% vs. an expected 0.4% rise - is quite interesting, to say the least. Listen, making long-term calls off of one day's reaction
to a surprise economic report would be a big mistake. We need to keep watching the charts and, more specifically, the IWF:IWD ratio:
Don't misunderstand me. There's still plenty of work left here. But this was an opportunity for the growth bears to pile onto the relative selling that's been taking place throughout 2021. It hasn't happened, arguing that the relative double bottom on the IWF:IWD from March and May was the ultimate bottom. That would receive some technical
confirmation if the relative high between those relative lows is cleared. That occurs at the 1.69 level that I've been discussing for months - since Q4 2020.
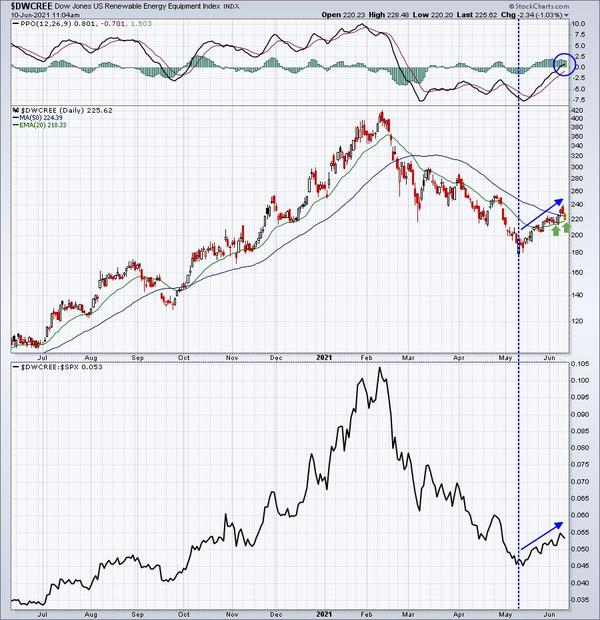
Renewable energy ($DWCREE) has been putting in signals that its brutal downtrend has ended. Today, Fuel Cell (FCEL) reported results that came up short of expectations and many stocks in the space were down in pre-market. Many of those same stocks, however, have shown resiliency and have moved into positive territory - behaving more like uptrending stocks. Here's a look at the daily chart of the DWCREE:
One requirement of an established uptrend is for the PPO to be above the zero line. The default daily PPO, which is what I always use, is the % difference between the 12-day EMA and the 26-day EMA. An uptrend should consist of a higher short-term moving average, which would result in that positive daily PPO. Of course, there are always head fakes, so let's keep an eye on that rising 20-day EMA. The two green arrows already show two successful tests there this
month.
I wanted to point out two well-known companies as their charts look quite interesting technically to me:
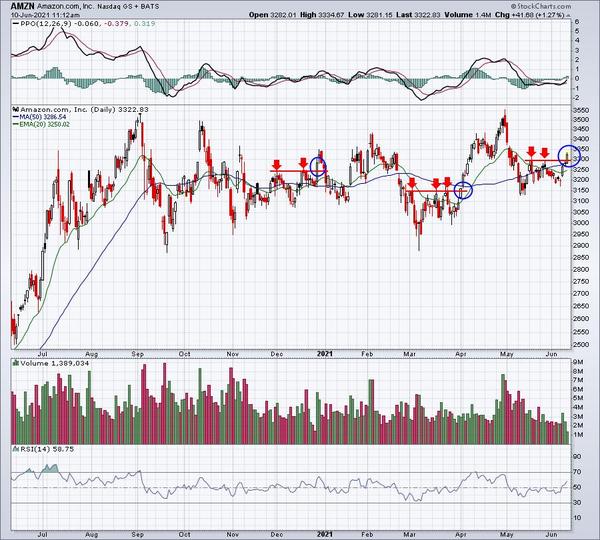
AMZN:
Clearing a price resistance level that's been tested multiple times can signal a nice uptrend ahead......or it can be a false breakout. Today, AMZN is clearing a key short-term price resistance level. Will it hold today? Will it hold into next week? That's a difficult call and AMZN has been sideways consolidating since September 2020. I don't own AMZN currently, but I'm watching it. If I do trade it, I'll use the double top close to 3550
as my target. Because it's traded above and below key moving averages throughout this consolidation, I'd use a close beneath the 50-day SMA as my cue to exit. That would be a solid reward to risk of approximately 6 to 1 (228 point profit vs. a potential 36 point loss). If every trade were set up with this type of reward to risk, you'd only have to be successful 1 time out of 6 to break even. Managing risk is the most important aspect of trading.
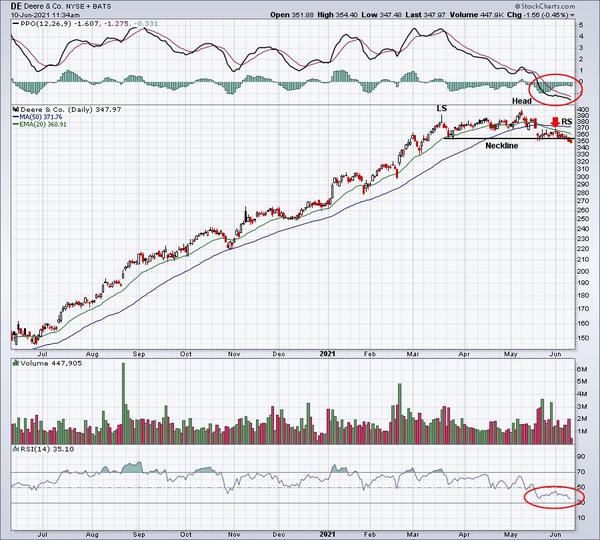
DE:
I find DE to be a very ominous-looking chart. The RSI is behaving very poorly. Normally, during an uptrend, we'll see a test of RSI 40 and then the stock will move to new highs. In this case, we've seen a feeble bounce attempt back to the now-declining 20-day EMA and failure. The daily PPO has fallen below the zero line and didn't even pause during DE's rebound attempt. Throw in what appears to be a head & shoulders breakdown and I'd
be very cautious here. I wouldn't own it right now. It will likely need months of consolidation, if not more, before we see another high.
Here are the key earnings reports for the next two days, featuring stocks with market caps of more than $10 billion. I also include a few select companies with market caps below $10 billion. Finally, any portfolio stocks that will be reporting results are
highlighted in BOLD. If you decide to hold a stock into earnings, please understand the significant short-term risk that you are taking. Please be sure to check for earnings dates for any companies you own or are considering owning.
Thursday, June 10:
CHWY, FCEL, SIG, PLAY
Friday, June 11:
None
Initial jobless claims: 376,000 (actual) vs. 369,000 (estimate)
May CPI: +0.6% (actual) vs. +0.4% (estimate)
May Core CPI: +0.7% (actual) vs. +0.4% (estimate)
Happy trading!
Tom Bowley
Chief Market Strategist
EarningsBeats.com
Better Timing. Better Trades.
|
|
|