Dear Digest Subscriber,
We hope that you've enjoyed this complimentary week of our Daily Market Report. We publish the Daily Market Report every weekday to provide our members with high reward-to-risk trading ideas. If you like what you see and want to continue receiving our report, plus receive access to other member-exclusive content, consider joining us for a NO COST 30-day
trial.
Happy trading!
Your EarningsBeats.com Team
Better Timing. Better Trades.
Daily Market Report
Friday, June 11th, 2021
Just a quick reminder that our Spring Special, our best annual deal of the year, ends on Tuesday, June 15th. This is your last weekend before the deal will be gone until next year. The annual special provides 14 months of membership (two bonus months!) for $997, 52% off the regular monthly rate of $147. For more information, CLICK HERE!
- Futures were bifurcated with the Dow Jones weak, while the S&P 500 was much more bullish
- After the opening bell, there was more rotation away from value and into growth
- Small caps and mid caps have turned out to be today's best performers
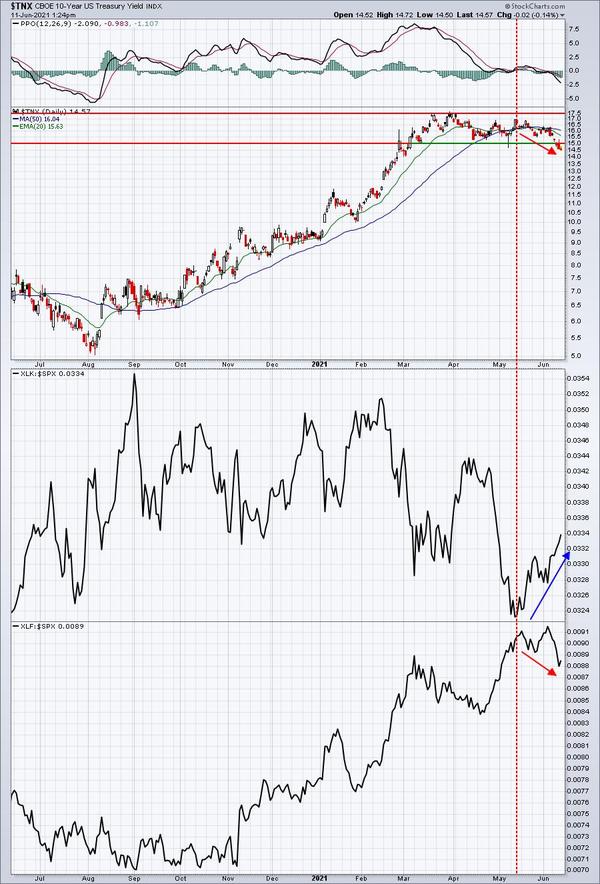
- The 10-year treasury yield ($TNX) is flat today at 1.46%, but continues in its recent descent
- Crude oil ($WTIC) is jumping again, up another 1.08% to $71.05 per barrel; if you recall, the breakout above $67 "measured" to $77 - we're on our way
- Gold ($GOLD) is down nearly 1% to $1878 per ounce and is at a 4-week relative low vs. the S&P 500
- The U.S. Dollar (UUP) is up 0.56% today and challenging a 4-week relative high; a close on the UUP above 24.40-24.45 would begin arguing for a higher dollar
- Health care stocks (XLV, -0.86%), June's leading sector, is the worst performer today as profit taking and rotation take a toll
The 10-year treasury yield ($TNX) is acting as though it's topped. That's not at all what I was expecting, but the bond market has taken the May CPI report completely in stride as the TNX trends lower and beneath 1.50% yield support:
I believe ignoring this development would be a mistake. As rates have rolled over and are starting to trend lower, you can see two obvious ramifications. The growth-oriented technology stocks are outperforming, while the financials underperform in this suddenly downtrending yield environment.
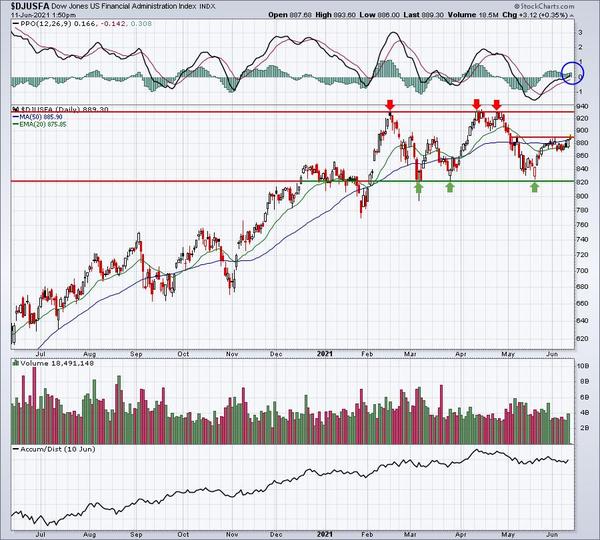
Yesterday, I pointed out that renewable energy stocks ($DWCREE) were showing more bullish signals of late. Another group that's been consolidating, but beginning to strengthen again is the financial administration area ($DJUSFA, +0.35%):
The upper and lower boundaries in this consolidation have been set. Short-term, note that the daily PPO has turned positive after being significantly negative. Despite that huge PPO move to the downside, price support was never lost. This helps to illustrate why I always discuss price/volume being the single-most-important indicator on a chart. I don't care how bad the PPO looks. If price support hasn't been lost in an overall uptrend, that bearish PPO takes a
back seat to the solid price support action that took place.
One of my favorite trading strategies is to wait for our portfolio stocks to hit key support levels or to break out. I'll hold them until they either break down beneath key price levels or if they begin to show slowing momentum on hourly charts. I'll give you two examples of portfolio stocks I've sold in the past two days. Before I do, let me say that I still really like both stocks and that I hope to pick them up cheaper short-term.
Usually a 3-4% pullback is what I look for. Here are the two stocks:
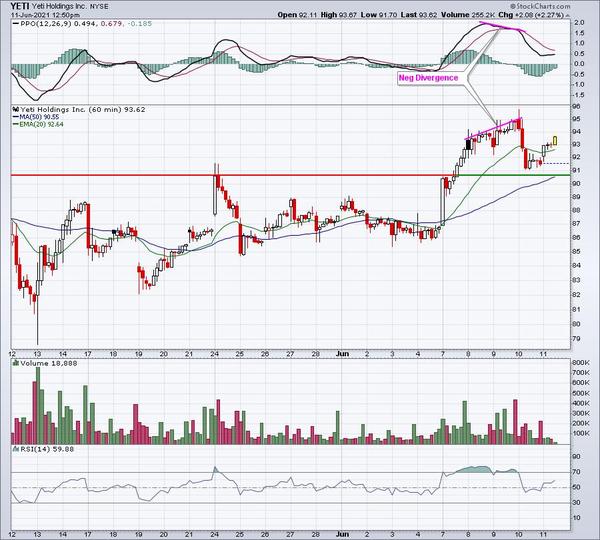
Let me be clear that 60-minute negative divergences can play out over a very quick 1-3 day period. So this is not anything that should concern someone holding these two stocks for longer-term periods. It's much more of a "trader thing".
I grow concerned when a third high is hit on an hourly chart with 3 lower hourly PPOs. Once I see that, if a stock begins to show any weakness whatsoever, I'll typically take my profit, exit, and then look for a re-entry point. This strategy isn't foolproof. I've seen stocks never hesitate and continue climbing. In that case, I may not be able to re-enter and I just move on. In the case of YETI, I didn't like that opening bearish engulfing
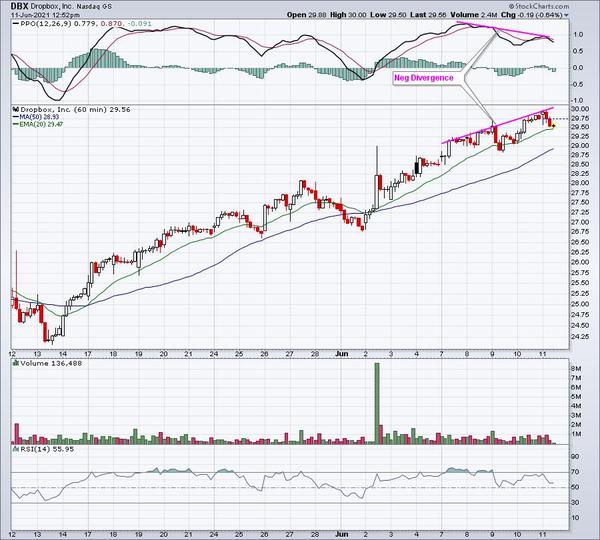
candle after nearly reaching 96. I ended up selling just below 94 and I'd like to re-enter around 91. If YETI can clear Thursday's high of 95.76, my odds of re-entering at 91 drop considerably. On DBX, I sold as soon as it moved into negative territory today. That string of negative divergences suggests the increased likelihood of short-term weakness, so I exited while hoping to re-enter in the 28.50-29.00 area.
I like both of these leading stocks, but I still would prefer to trade them. It's just my trading style. It's important to know what works for you and what doesn't.
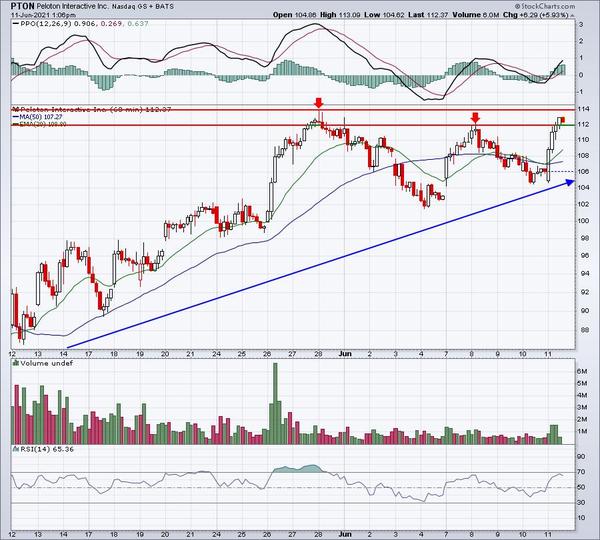
Here's an unrelated chart of Peloton (PTON), whose selling was completely overdone, in my opinion. Note on this chart it's simply a case of price resistance - I'd be a seller in the 112-114 area until it proves that it can clear this level on confirming, above-average volume:
If sellers keep showing up at 112-114, why would I want to hold? Worse yet, why would I want to buy? I believe PTON is heading higher, but I have no clue whether it'll be now or weeks or months down the road. A short-term trader will take the sure thing. An evaluation of the chart can always be done to consider re-entry either higher or lower based on the new data.
Here are the key earnings reports for the next two days, featuring stocks with market caps of more than $10 billion. I also include a few select companies with market caps below $10 billion. Finally, any portfolio stocks that will be reporting results are
highlighted in BOLD. If you decide to hold a stock into earnings, please understand the significant short-term risk that you are taking. Please be sure to check for earnings dates for any companies you own or are considering owning.
Friday, June 11:
None
Monday, June 14:
None
June consumer sentiment: 86.4 (actual) vs. 84.0 (estimate)
Happy trading!
Tom Bowley
Chief Market Strategist
EarningsBeats.com
Better Timing. Better Trades.
|
|
|