Daily Market Report
Tuesday, June 8th, 2021
Just a quick reminder that our Spring Special, our best annual deal of the year, ends one week from today on Tuesday, June 15th. The annual special provides 14 months of membership (two bonus months!) for $997, 52% off the regular monthly rate of $147. For more information, CLICK HERE!
- Futures were higher, though strength hasn't lasted
- The S&P 500 opened at a level that would have represented an all-time high close, but it's backed off
- The NASDAQ showed early leadership, but that has waned
- Growth opened in favor, but that too has changed
- Cryptocurrencies are tumbling today with bitcoin and etherium down 11% and 13%, respectively
- Crude oil ($WTIC) remains strong, up 0.71% and hanging just below $70 per barrel
- Semiconductors ($DJUSSC, -0.88%) have turned lower after nearing 7200 and moving close to its April all-time high
- Energy (XLE, +0.90%) is leading today, beneficiary of those higher crude oil prices
- Big inflation reports are approaching, making short-term trading especially treacherous right now
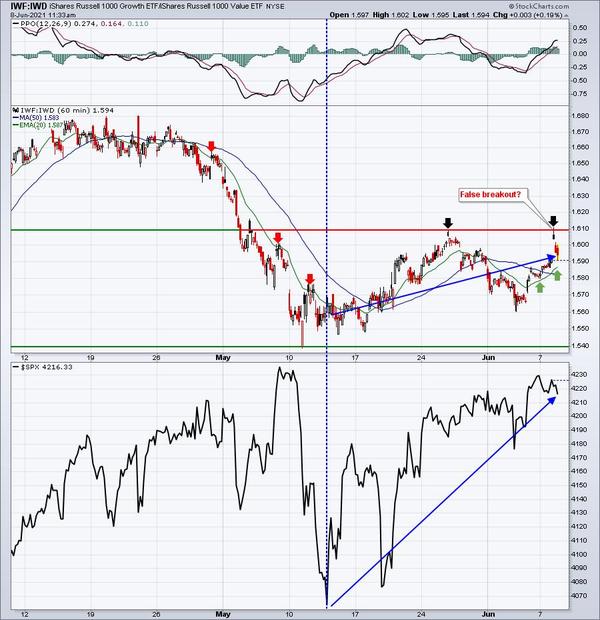
This is a very strange period in the market and we're beginning to see the crazy volatility associated with the "potential" of inflation. We started off the day in very bullish fashion as the growth vs. value ratio (IWF:IWD) hit its highest level since the last CPI/PPI reports were released. The 10-year treasury yield ($TNX) fell 6 basis points to 1.51% before bouncing in the past hour or so. The jump in growth stocks has eroded throughout the session as you can
see from the chart below:
I believe we're at a very important short-term crossroad. Since that inflation-induced May low on the S&P 500, growth stocks have actually been leading the recovery - a bullish signal. But on Thursday morning, we're likely to see another CPI report that shows the highest inflation this decade. Was today's false breakout on this IWF:IWD ratio the short-term top for growth stocks and for the market? Obviously,
it's too early to tell, but I've grown more defensive, willing to wait and see if this ratio breaks out. If inflation is hot as nearly everyone expects, and the growth stocks lead an S&P 500 breakout to an all-time high, that tells me the whole inflation story is way overblown. If, however, this ratio drops back to 1.55% while the S&P 500 falls back from its all-time high level, that would be a different story altogether.
Interesting times indeed.
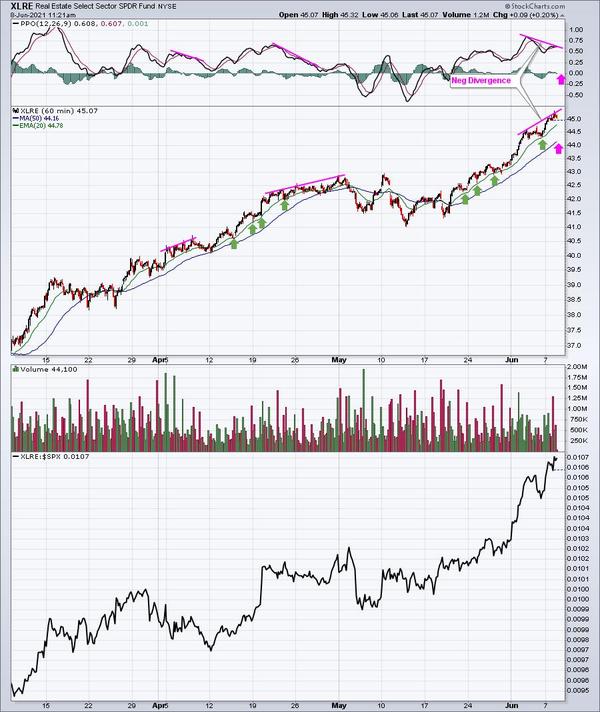
Yesterday, I covered real estate (XLRE) and I want to expand on that today because a negative divergence is suggesting the short-term risk is increasing in this area. These divergences provide us no guarantees, they simply signal to us that risks are increasing. Here's the latest 60-minute chart showing the negative divergence:
Warnings in the past have panned out, so it certainly makes sense to at least consider the short-term warning. Longer-term, real estate remains a very solid sector. Short-term, however, things are getting a bit dicier with the slowing momentum evident in the lower PPO. The green arrows above highlight the successful 20-day EMA tests. But when the PPO begins to weaken, those 20-day EMA tests are much more "iffy". I'd respect this signal and consider lightening
the real estate load.
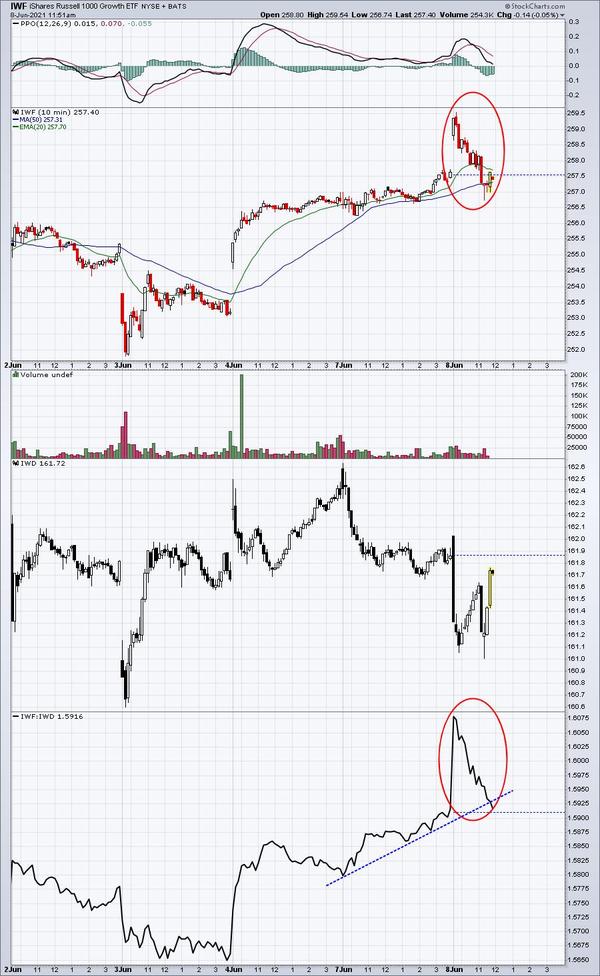
I would love to say I know exactly what's going to happen next in this wacky market, but I don't. If you can correctly predict how the stock market is going to prep for the upcoming inflation reports and then how it will react after, you can make a lot of money. But if you're wrong, you can lose a lot quickly. This morning, the growth stocks were very quick out of the gate and they've completely reversed. Maybe they'll recover again
later, or maybe they won't. The upcoming inflation reports present enough risk where I'm trying to avoid much of the volatility and save my capital to trade another day. I want you to look at the IWF, the IWD, and the ratio of the two below:
Not knowing whether growth or value is in style or whether the S&P 500 will break out or fail at 4232 makes it very difficult to accurately predict the direction of anything. I'd offer this up. I'd respect price resistance and I'd respect the last several months' failures in growth stocks. In other words, holding growth stocks into these inflation reports the next few days will require lots of courage. Keep stops in place just to
make sure poor trades are exited fairly early.
Here are the key earnings reports for the next two days, featuring stocks with market caps of more than $10 billion. I also include a few select companies with market caps below $10 billion. Finally, any portfolio stocks that will be reporting results are
highlighted in BOLD. If you decide to hold a stock into earnings, please understand the significant short-term risk that you are taking. Please be sure to check for earnings dates for any companies you own or are considering owning.
Tuesday, June 8:
PATH, CASY, THO, NAV, ASO, ABM, MOMO, CVGW
Wednesday, June 9:
BF/B, GME, CPB, RH, VRNT, UNFI, OXM, LOVE, VRA
EarningsBeats.com
Better Timing. Better Trades.
|
|
|