Dear Digest Subscriber,
As a THANK YOU to our community for your support and interest, you will receive a free week of our Daily Market Report (DMR) published by Tom Bowley, Chief Market Strategist. It includes premium content that is typically reserved for our paid members. You'll find today's DMR, as well as a link to today's webinar, in the message below. Stay tuned throughout the week for more articles to come.
Enjoy!
Your EarningsBeats.com Team
Better Timing. Better Trades.
Daily Market Report
Monday, June 7th, 2021
Today at 4:30pm ET, I'll be hosting a special event, "Preparing for Shocking Inflationary Data". This event is open to everyone and you can attend simply by clicking on the following room link after 4:00pm ET today:
https://earningsbeats.zoom.us/j/84093765725
I'll be looking at history to determine what areas might be positively influenced by hot inflationary data and which areas to consider avoiding.
- Futures were mixed and close to the flat line as we opened a new trading week
- Inflation data will be out later this week as the S&P 500 is trying to negotiate its all-time high close near 4232; it's been a failure so far, but it's still early
- Crude oil ($WTIC) is taking a breather to start the week, down 0.72% after nearly closing last week at $70 per barrel
- The NASDAQ has held up better since the open, an interesting development to watch throughout the week
- Real estate (XLRE, +0.94%) and health care (XLV, +0.86%) are today's leading sectors; the latter is getting a lift from an FDA approval of an Alzheimer's drug from Biogen (BIIB) and Moderna (MRNA) strength
- Materials (XLB, -1.47%) are weak, despite selling in the dollar (UUP, -0.19%)
- The 10-year treasury yield ($TNX) is flat today; inflation data on Thursday could change things here significantly
- Ely Lilly (LLY, +8.82%) is the best S&P 500 performer, also aiding health care
- Only 8 of 30 Dow Jones component stocks are higher today and none are up more than 1%
There is almost nothing on the economic calendar for this week. Initial jobless claims will be released on Thursday as they always are, but otherwise it's a slow week. That will make the May CPI report on Thursday an even bigger deal than it already is. Currently, forecasts are looking for the May CPI to rise 0.4%. Core CPI is also forecast to rise a similar percentage. On StockCharts.com, you can chart CPI and PPI with the
following symbols:
- CPI ($$CPI)
- Core CPI ($$CCPI)
- PPI ($$PPI)
- Core PPI ($$CPPI)
I like to chart these on a monthly basis since the data only changes once per month. Then by looking back over the past 30, 40, or 50 years, you can get a sense of what inflation looks like with perspective. The 12-month rate of change indicator can be used so that you'll get a sense of the year over year look to help smooth out the monthly pops and drops.
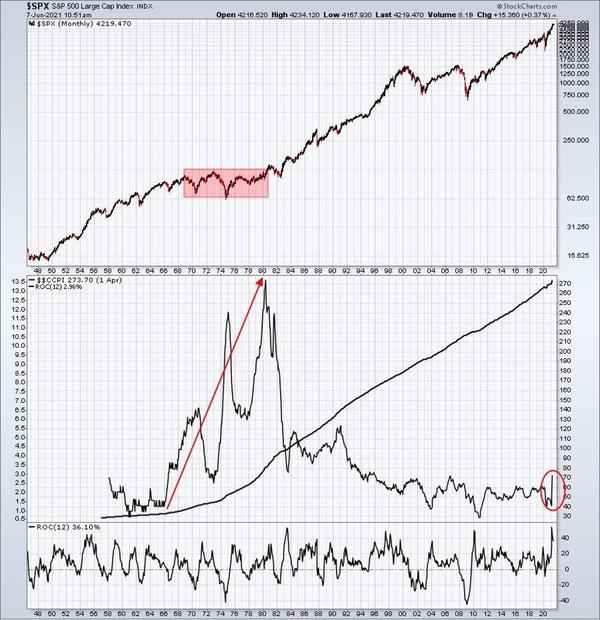
During the late-1960s and into the 1970s, inflation became a HUGE problem and was the primary reason the S&P 500 fell into a 12-13 year secular bear market. Clearly, we want to make sure current inflationary problems don't escalate. I don't believe we have that problem, but here's a chart to highlight the importance of staving off inflation:
At the very bottom of this chart, you'll see the 12-month Rate of Change (ROC) for the S&P 500. Look at that low in 1974. The S&P 500 fell more than 40% after inflation had surged to 12%. Some fear mongers will point to that as the reason the S&P 500 will collapse. I believe this scenario is extremely unlikely, but anything is possible.
That's why it's so important to watch the numbers and, at the same time, watch to see the rotation in the market. Inflation started rising in 1966, but it didn't truly become a market problem until 1974. So even if inflation stays with us longer than I expect, it doesn't mean we'll see equity prices collapse. That has not been the history of the stock market.
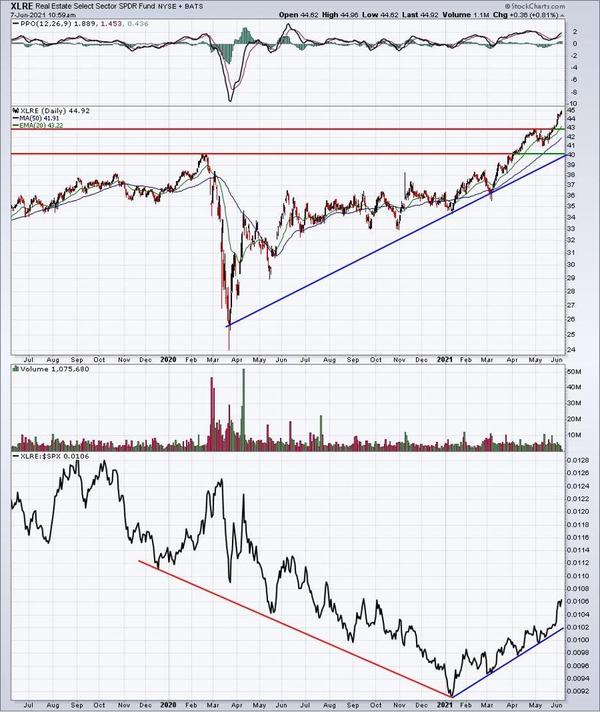
Should we be overweighting real estate (XLRE) now because of inflation concerns? Well, I'll discuss that much more during our session later today. The XLRE has been performing exceptionally well of late, but my opinion is that the reopening trade is having much more to do with that than any long-term
inflationary concerns. Here are the current absolute and relative charts:
Real estate is performing very well, as is just about every area of the market. It's simply the rotation that we see move the buyers from one area to another. Since the beginning of the year, real estate is performing well on a relative basis, but I'd simply continue to follow that relative uptrend
line. As long as that holds, investing in this area of the market makes perfect technical sense.
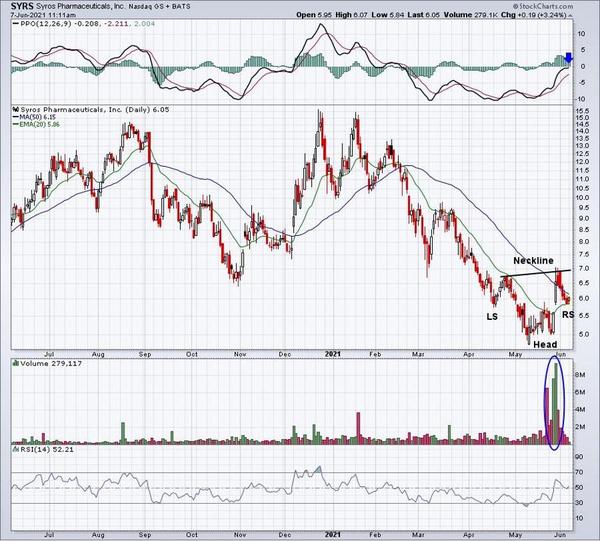
I pulled up hundreds of charts over the weekend, some on our ChartLists, others not. I was looking for patterns to illustrate what I look for in stocks that I'm considering trading. Here are two that I thought looked quite interesting:
This is a small biotech, so please understand the much higher risk involved, but I like this bottoming reverse head and shoulders formation. I always look for the right side of a neckline to be higher than the left side as it suggests enough upside momentum to clear the prior
high. The massive volume is a bonus. Last week's selling back down to test the now-rising 20-day EMA has established a potential reverse right shoulder. A breakout above 7 would confirm the pattern. I'd grow much more concerned if the right shoulder was lost.
To avoid chasing stocks and risking bigger losses, I tend to favor stocks like REZI. After trending higher for months, it has been in a bullish rectangular consolidation pattern. It appears to just now be breaking out and trending higher, though I'd be even more bullish if
volume were to escalate as this breakout is made. Note the circles highlighting both the PPO centerline "reset" at zero and the RSI trip back down near 40. This typically represents the best reward-to-risk entry point. We can watch this one to see if it pans out. To the downside, loss of 20-day EMA support on a closing basis would be an initial warning sign to exit.
Here are the key earnings reports for the next two days, featuring stocks with market caps of more than $10 billion. I also include a few select companies with market caps below $10 billion. Finally, any portfolio stocks that will be reporting results are
highlighted in BOLD. If you decide to hold a stock into earnings, please understand the significant short-term risk that you are taking. Please be sure to check for earnings dates for any companies you own or are considering owning.
Monday, June 7:
MRVL, COUP, MTN, HQY, SFIX, GIII, REVG
Tuesday, June 8:
PATH, CASY, THO, NAV, ASO, ABM, MOMO, CVGW
EarningsBeats.com
Better Timing. Better Trades.
|
|
|