EarningsBeats.com Digest for April 9, 2021
|
Check out two upcoming events you WON'T want to miss!
Upcoming Earnings ChartList
To download/view the earnings reports for April 9th, CLICK HERE. Be sure to use the password "EARN2543" when prompted. The password is case sensitive.
Bullish Continuation Pattern Points To Higher Prices
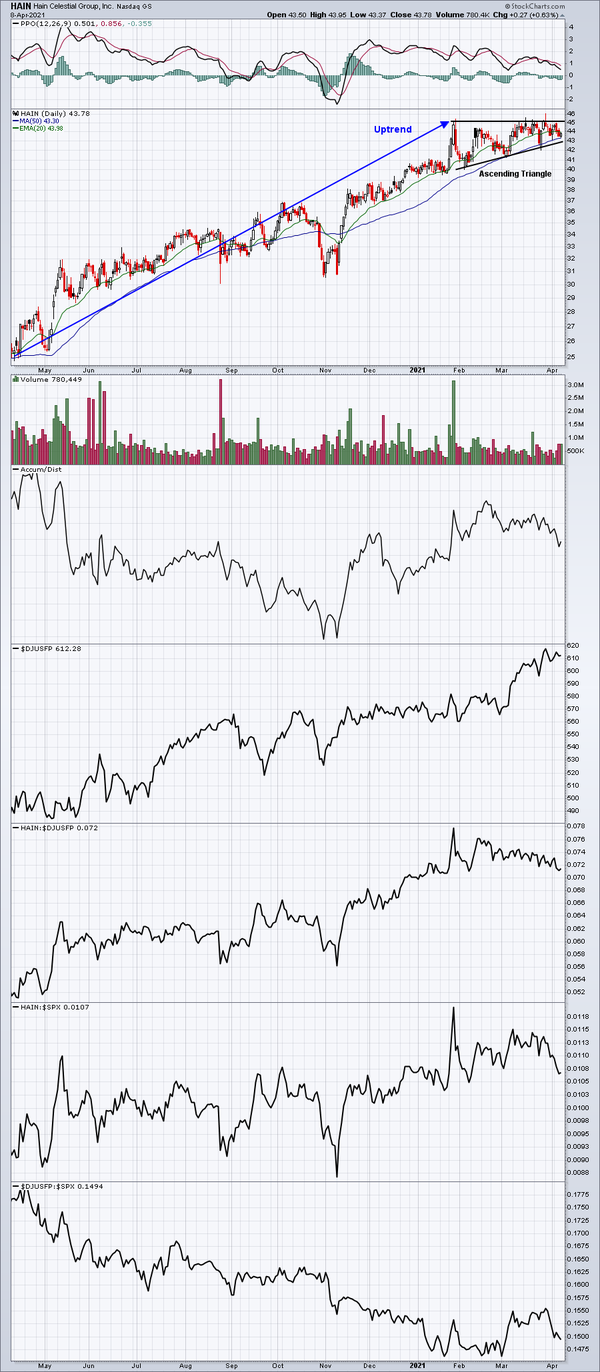
Technical analysis comprises a lot of different aspects of trading, but one that stands out is pattern recognition. When I feel that we're in a secular bull market, as I do now, I look for highs followed by bullish continuation patterns. I look for the patterns to emerge and, in my opinion, Hain Celestial Group (HAIN) is awaiting breakout of one. HAIN has seen multiple highs print near the 45 level, while lows continue rising along the 50 day
SMA:
You can visualize the many attempts to clear the 45 price resistance, all while each low keeps getting higher and higher. This is the essence of an ascending triangle. After reporting quarterly revenues and EPS that beat Wall Street consensus estimates, HAIN began trading in this very bullish ascending triangle pattern. A breakout above 45 on confirming volume would measure initially to 50. Ascending triangle measurements are based on the
distance between the top of the triangle and that initial low. In the case of HAIN, that would be the difference between 45 and 40, or 5 bucks. We add that to the breakout level of 45 and get an initial measurement of 50.
Happy trading!
Tom Bowley
Chief Market Strategist
EarningsBeats.com
Better Timing. Better Trades.
|
|
|