EarningsBeats.com Digest for January 13, 2021
|
Trading Places Live!
Join Tom Bowley for a briefing on market activity on Mondays and Wednesdays from 9-9:30 am EST before the opening bell. Click here to listen live or visit our YouTube page later today to view the recorded session.
"January Options: Max Pain" Webinar
During yesterday's Members Only "January Options: Max Pain" webinar, EarningsBeats.com Chief Market Strategist Tom Bowley zeroed in on the major indexes and several stocks to see which ones might be ripe for a strong move to the upside or downside as we close in on monthly Options Expiration Friday, the third Friday of the month. Always a fascinating exercise and a great way to learn about "Max Pain" while having a few trading candidates to consider - or avoid!
If you are not already an EarningsBeats.com subscriber and would like to access the recording - along with a FREE 30 day trial - just click on the link below and you will be able to listen to what Tom had to say.
When Is The Right Time To Sell A Stock?
This is definitely a topic that I could write dozens of articles about. The first question that must be asked is, "Are you a short-term trader or more of a long-term investor?" Because the answer to when to sell is highly dependent on your trading strategy. For purposes of today's article, let's assume we're short-term trading. Key price support/resistance and key trend-following moving averages are critical for me. To provide you
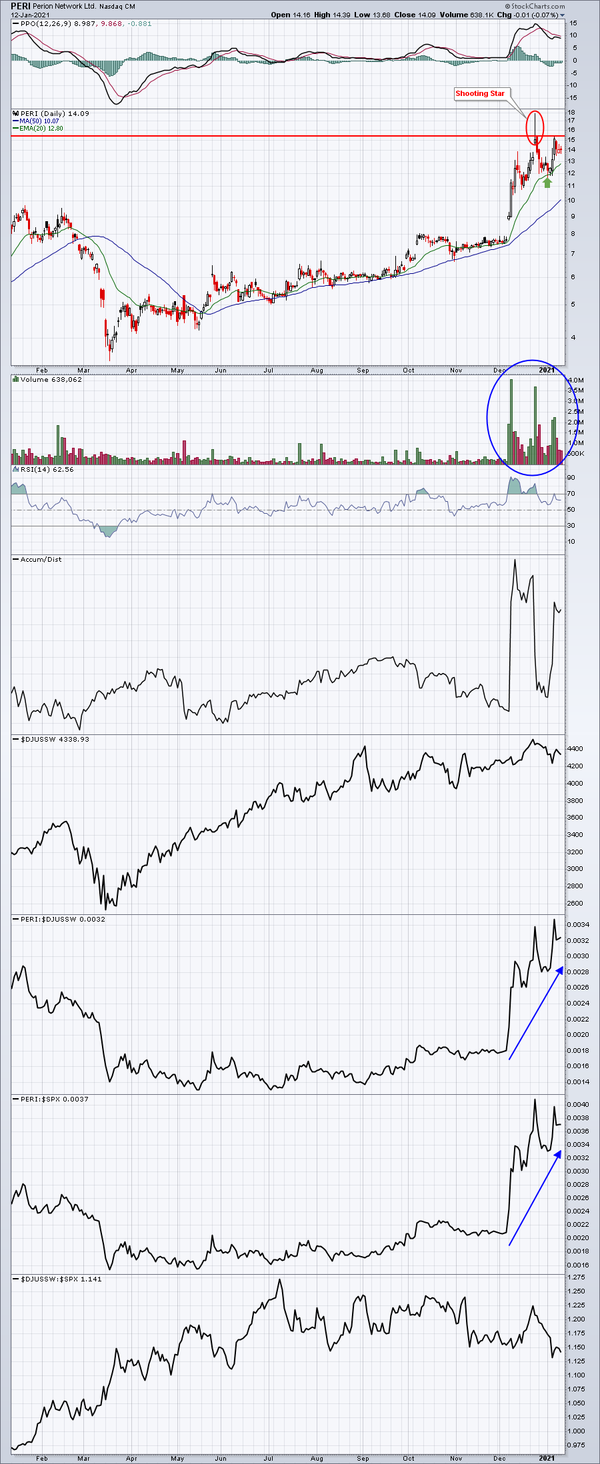
an example of things to consider, let's look at the chart of Perion Network (PERI):
First, look at the volume that accompanied that huge gap higher in early December. Clearly, traders are much more interested in PERI now than they were just 6-7 weeks ago. PERI pre-announced much better than expected revenues and earnings and the chart reflects a major adjustment to PERI's valuation as a result. Short-term inefficiencies also result from sudden surges like this. For instance, note the reversing shooting star candlestick
that printed after the big gap higher on December 23rd. That suggested a short-term pullback and PERI quickly moved down to its 20 day EMA near 12.00 (green arrow). Entering on the rising 20 day EMA yielded a 27% return in 3 days if your target was simply a retest of the candle body high on December 24th of 15.31. The January 7th intraday high was 15.30, just one penny from key price resistance. A trader takes profits there and perhaps awaits another 20 day EMA test for
re-entry. PERI's chart looks spectacular, in my view, though it is a rather volatile stock, suggesting that only those with high risk tolerance levels should consider it.
Happy trading!
Tom Bowley, Chief Market Strategist
EarningsBeats.com
"Better Timing. Better Trades."
|
|
|