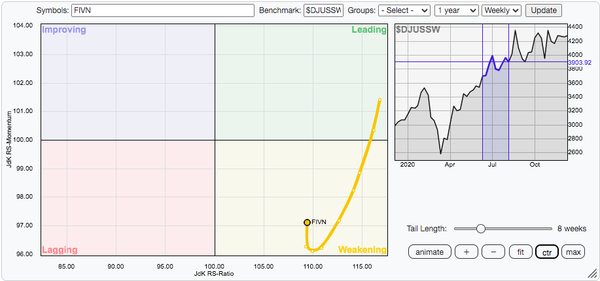
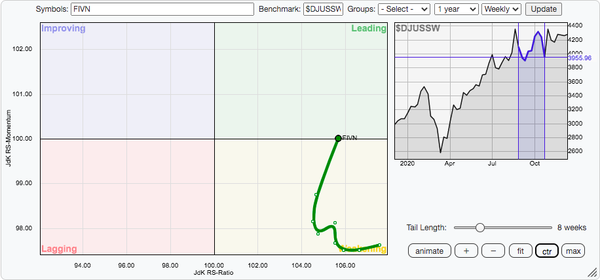
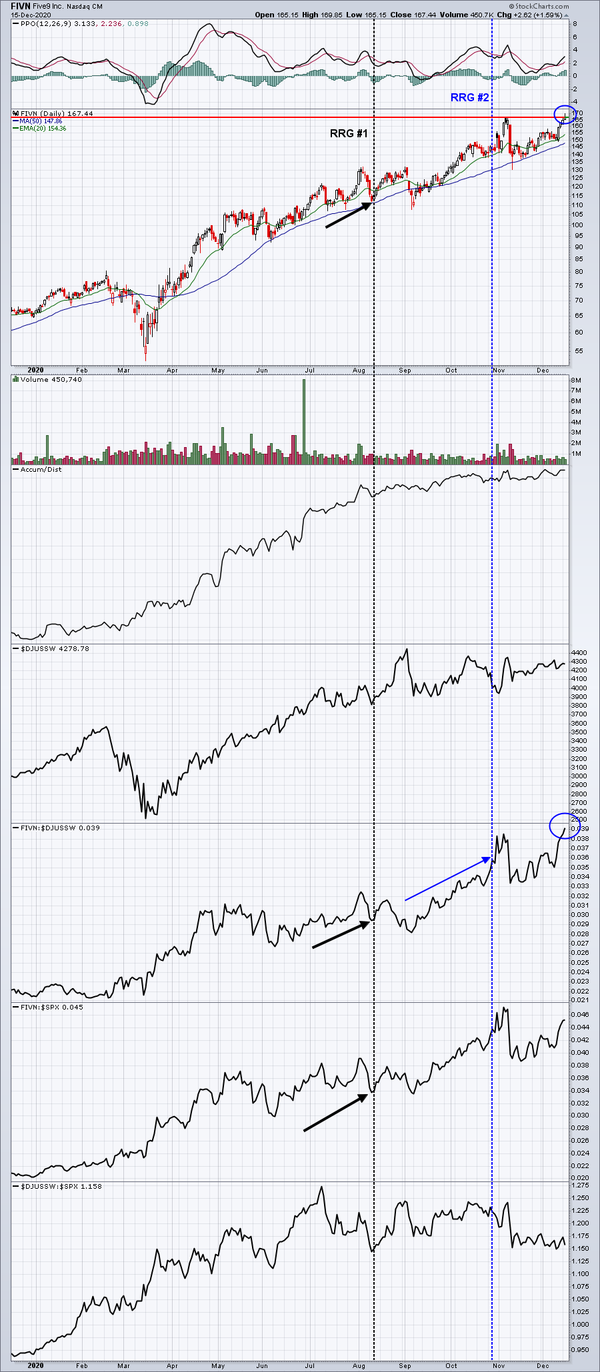
The interesting part about the first RRG chart is that FIVN was beginning to turn back higher at a time when its price and relative strength was bottoming (black-dotted verticle line) on the price chart. At the time of the second RRG chart, which coincided with FIVN moving back into the leading quadrant, relative strength was already soaring (blue-dotted vertical line). I believe this is a very important lesson, because if you wait for a stock to
return to the leading quadrant before entering, a big move has already been made. That is simply confirming the much earlier signal that told us that FIVN was beginning to see a return of strength.
At EarningsBeats.com, we constantly discuss the importance of owning leading stocks in leading industry groups. FIVN is one more example of that, and it shows how the use of RRG charts can be useful in identifying returning strength even BEFORE we see it on relative price charts.