EarningsBeats.com Digest for September 25, 2020
|
Two Upcoming Events!
"Short Squeeze ChartList" Webinar
(Saturday, September 26, 11:00 am eastern)
Companies with a high short percentage of float (traders betting against the stock) that break out above key resistance many times trigger a "short squeeze" and move substantially higher as those who are short scramble to cover their positions. The potential of unlimited losses on a breakout creates a very emotional decision for short sellers, resulting in a panicked buying episode.
During Saturday's event, Tom will provide several examples of short squeezes and also discuss companies on our Short Squeeze ChartList that would likely become short squeeze candidates if certain key price resistance levels are cleared.
Best of all, EVERYONE attending this event will receive access to the 72 companies currently on our Short Squeeze ChartList. It should be a very educational event and one that you won't want to miss! CLICK HERE to join the event. The room will open 30 minutes prior to start. We will also send you a reminder tomorrow morning prior to the start of the webinar.
"Q4 Market Outlook" Webinar
(Monday, September 28, 4:30 pm eastern)
The third quarter is nearing an end, and what a volatile quarter it has been! Now we're getting ready to move into Q4 with Earnings Season right around the corner. What signs can we look for that will help us navigate the market?
During Monday's event, Tom will review some of the key indicators he relies on when determining market direction. This will include looking at critical historical information as well as where the market stands today.
This is a members only event that will be open to both existing subscribers as well as those who start a NO COST 30-day trial.* Key membership features include:
- Access to Tom Bowley's comprehensive Daily Market Report - a must read!
- Access to EXCLUSIVE Strong Earnings ChartList (484 companies that BEAT revenues and EPS) plus other additional, valuable ChartLists such as:
- Accumulation/Distribution ChartLists (Weak + Strong)
- Short Squeeze ChartList
- Strong Future Earnings ChartList
- Raised Guidance ChartList
- Access to Pre-Defined Scans - We set up the scans for you!
- Access to our 4 portfolios, including our flagship Model Portfolio, up 136% (Updated 09/23/2020) since its November 19, 2018 inception (vs the S&P's increase of 20.3% over the same period of time)!
*Trials valid once per customer.
When Selling May Actually Be Buying
I wrote a Trading Places blog article on Thursday titled, [http://"Tesla (TSLA) is Being Accumulated, Not Distributed - Check out These Two Indicators!"]"Tesla (TSLA) is Being Accumulated, Not Distributed - Check out These Two Indicators!". The premise of the article was quite similar to what we had experienced back in March 2020. There were constant gaps to the downside at the opening bell, but followed by mostly buying throughout the trading day.
The illusion was that Wall Street was selling big time, when, in fact, the opposite was true. The large gap downs were created by fear as the media was unrelenting. But after several wicked opens, institutions were happily buying everyone's shares. It showed up on charts in the form of rising accumulation/distribution lines (AD lines). In September, we've been seeing a similar scenario with Tesla (TSLA) and in my earlier TP blog article, I indicated that I'd provide
another stock in this morning's EB Digest that I believe is being accumulated, despite its September selloff. Here it is:
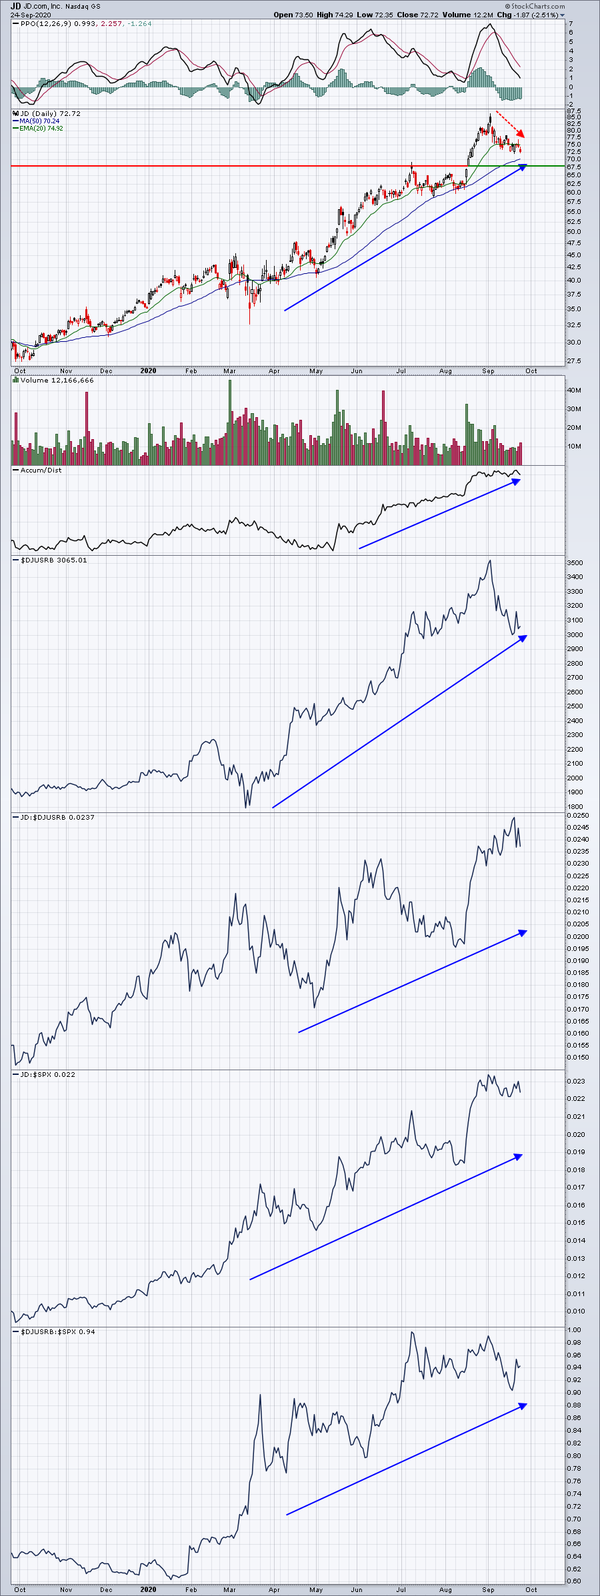
JD's AD line remains rock solid and it's clearly a leader in the broadline retail space ($DJUSRB). Broadline retail has been one of the strongest industry groups since the market topped in February 2020. JD checks off all the boxes for me. It's a leading stock within a leading industry group with
excellent volume trends and a rising AD line. If I'm correct that Q4 will be kind to U.S. equities, I believe JD will be a major beneficiary. Should we see a bit more September selling, JD could reach key price support near 68. But between that price support and the 50 day SMA, currently at 70.24 and rising, I'd look for a reversing candle. Its recent price high in early September was close to 87. That would be my short-term target and where the right side of a cup
might form.
Happy trading!
Tom Bowley
Chief Market Strategist
EarningsBeats.com
Better Timing. Better Trades.
|
|
|