EarningsBeats.com Digest for May 1, 2020
Dear Digest Subscriber,
We have a free ChartList for you! Our Strong Earnings ChartList with 112 companies that beat top and bottom line estimates is consistently updated to present EarningsBeats.com members with strong trading candidates. And today, as an EarningsBeats Digest subscriber, YOU now have access to the list as a thank you for reading our newsletter!
If you are an Extra level member or higher at StockCharts.com, you can download the ChartList directly into your account using a link and password (and if you're not an Extra level member, no worries - you can still view it!). Just follow these steps:
- If you're an Extra level member or higher, first log-in to your StockCharts.com account.
- Click the link below and enter this case sensitive password: SECL0427T
- If you're an Extra level member or higher, click Save to ChartList to copy it into your account.
In addition to our Strong Earnings ChartList, which is updated every 2-3 weeks, we also provide our members with a number of other ChartLists - including our highly popular Strong Accumulation/Distribution (AD) ChartList with 372 companies and our Weak AD ChartList with 268 companies.
To receive access to these ChartLists (plus more), consider joining us for a NO COST 30-day trial. Trials are valid once per customer. If you have previously subscribed as a trial member, please email us at support@earningsbeats.com for
other membership options.
Knowing What To Avoid Is As Important As Knowing What To Buy
|
As more and more companies approach their quarterly earnings report, we need to understand that Wall Street has been conversing with management teams of these companies and has been placing bets on the bullish and bearish scenarios. While we have been largely focused on companies showing relative strength and strong accumulation/distribution lines, many companies are showing the opposite and, therefore, I'd be extremely cautious holding these companies
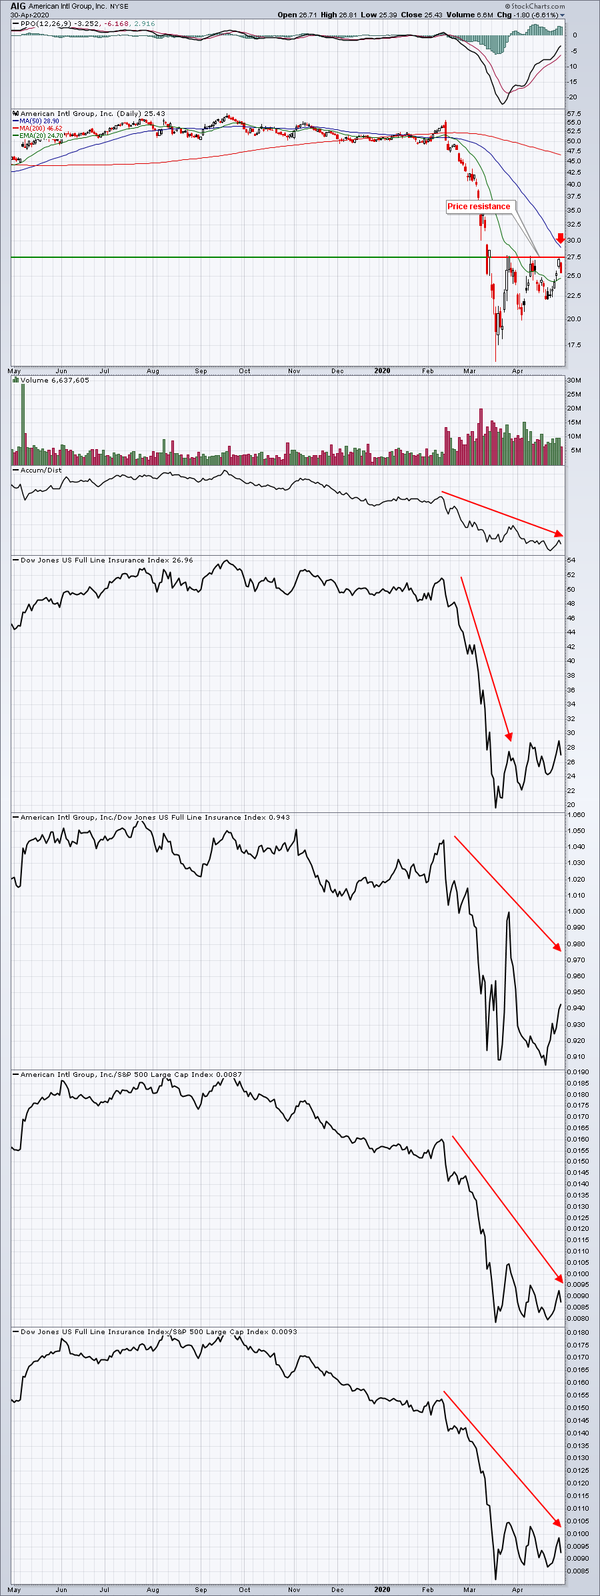
into earnings reports. One example would be American Intl Group (AIG), which reports quarterly results before the bell on Monday, May 4th:
AIG has a very weak AD line and has struggled on multiple occasions near the 27.50 level. On Thursday, AIG fell 6.6% and now needs to hold its 20 day EMA. It may eventually break key price resistance and its rapidly-declining 50 day SMA (red arrow), but I'd need to see it first. In the meantime, I believe the path of least resistance is lower. There is nothing at all bullish about this chart. Its industry group has been under a ton
of selling pressure and AIG has been among the worst vs. its industry peers. Monday's quarterly earnings may provide details of what Wall Street has been seeing for weeks. Anything is possible, but the odds are stacked against the bulls. Keep that in mind.
Happy trading!
Tom Bowley
Chief Market Strategist
EarningsBeats.com
Better Timing. Better Trades.
|
|
|