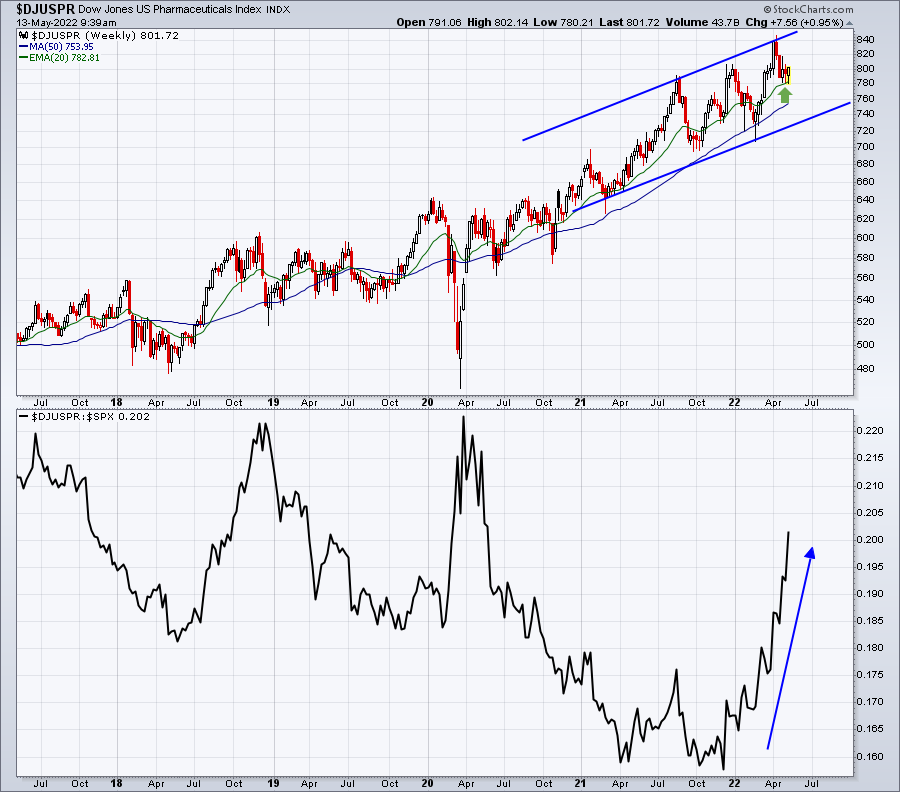
This weekly chart shows that pharmas have pulled back in recent weeks to test its 20-week EMA, which can represent an excellent reward-to-risk entry point. Failure to hold this 20-week EMA could lead to a test of the 50-week SMA or even the bottom of channel support, so you do want to make sure you place stops on all trades. That bottom panel, however, really shows the power of this group relative to the S&P 500. It doesn't mean that
pharmas go up every day, but it certainly demonstrates their consistent ability to outperform the S&P 500. And, after all, isn't that what our objectives in investing/trading are all about?