EarningsBeats.com Digest for February 16, 2022
|
Trading Places Live!
Join Tom Bowley for a briefing on market activity on Mondays and Wednesdays from 9-9:30 am EST before the opening bell. Click here to listen live or visit our YouTube page later today to view the recorded session.
Upcoming Earnings ChartLists
Our ChartLists for this week's upcoming earnings are now available. Click below to access the ChartLists. If you like what you see, consider joining us for a NO COST 30-day trial to receive access to our member-exclusive content.
Join Us For Today's Event...
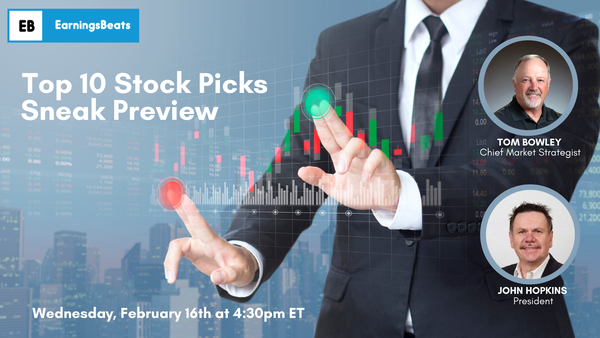
Top 10 Stock Picks: Sneak Preview
Wednesday, February 16th at 4:30pm ET
Join Tom Bowley, Chief Market Strategist as he discusses what will be covered during the Top 10 Stock Picks webinar on Monday, February 21st. This discussion will include a review of the results to date for the Model, Aggressive, Income, and Strong Accumulation/ Distribution (AD) portfolios.
This is a public event and you're invited. Room instructions will be emailed out later today and the event will be recorded for those unable to attend live. See you there!
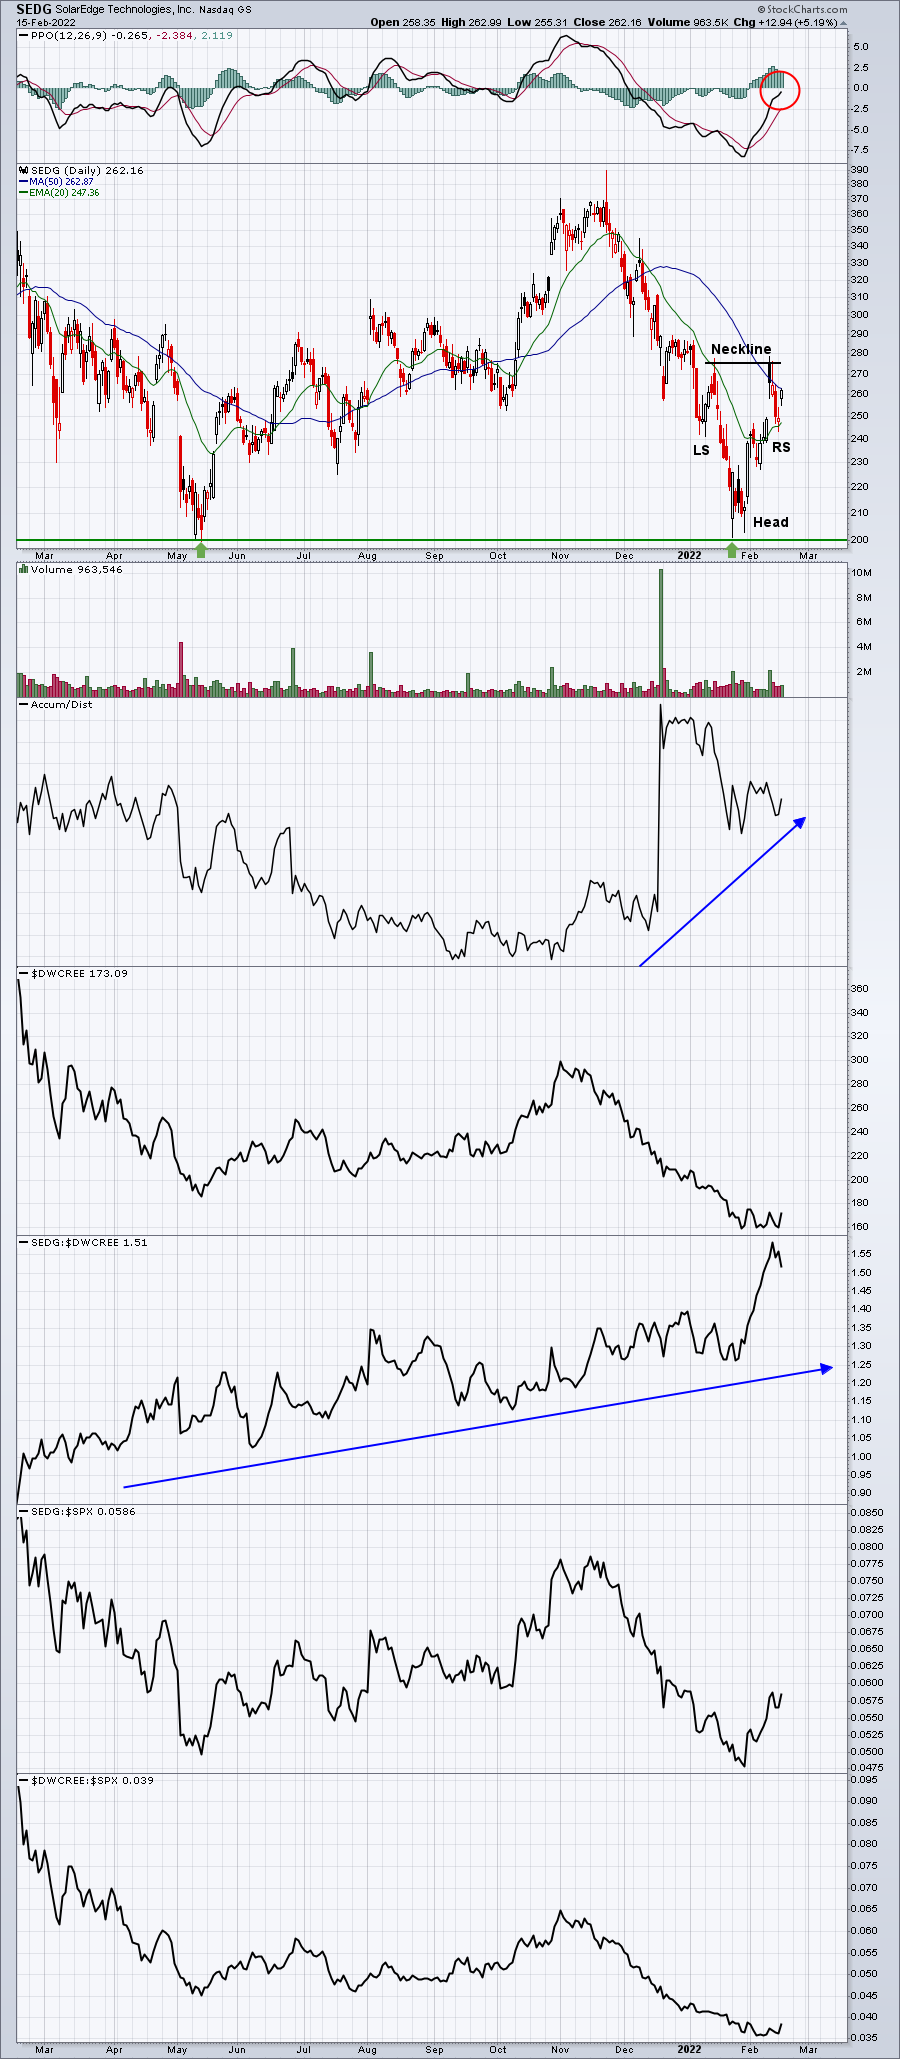
Key Levels to Watch After a Mixed Earnings Report
SolarEdge Technologies (SEDG) reported mixed results after the closing bell on Tuesday and, from a technical perspective, this one could go either way. Long-term price support has been holding close to 200, but with SEDG currently trading near the 260 level, we don't want to risk 60 bucks down to support, so what should we do? Well, after
missing Q4 earnings estimates, SEDG provided Q1 revenue guidance that was well above consensus estimates. The chart reflects all of this confusion:
Are we downtrending or bottoming? Personally, I think that depends on what happens from here. SEDG has been a strong leader within the renewable energy space ($DWCREE). The problem has been that the overall group's performance has been horrid. So while SEDG has been a relative leader, it still has serious issues because of its industry group. I'd watch the rising 20-day EMA and the reverse right shoulder as the two key support
levels. Meanwhile, overhead resistance is clearly marked at neckline resistance close to 275. A breakout there would measure 75 points to 350. Loss of right shoulder support would most likely result in another price test near 200. If I was more bullish the overall market, I'd be buying SEDG, but the potential for much more weakness ahead in a cyclical bear market makes me hesitate. If I went long given the bullish bottoming reverse head & shoulders, I'd make
sure I kept my stop intact on any close beneath the 245 level.
|
Tom Bowley
Chief Market Strategist
EarningsBeats.com
Better Timing. Better Trades.
|
|
|
|