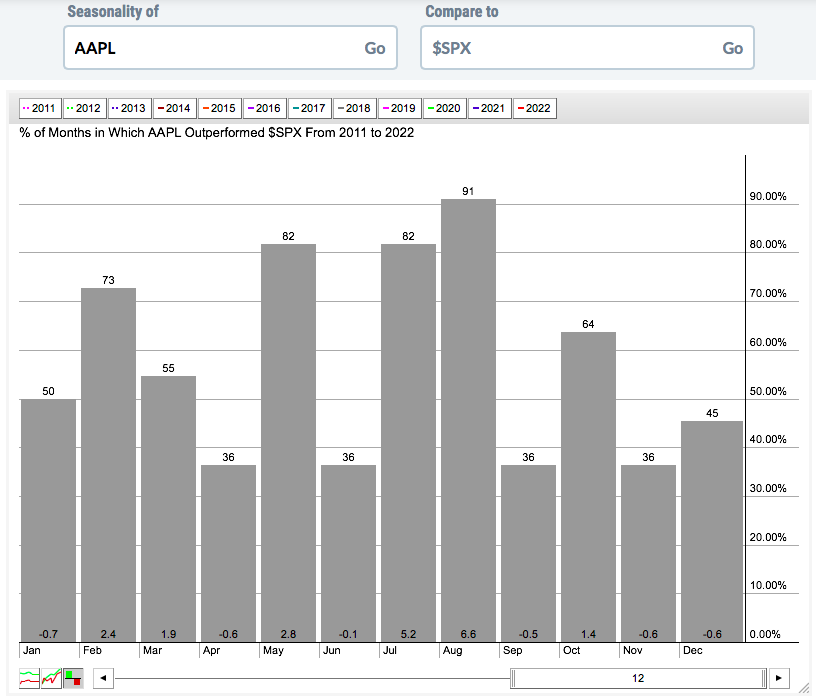
I found a couple interesting seasonal facts from this chart. First, and I was very surprised to see this - over the past 12 years, AAPL has underperformed the S&P 500, on an average return basis, in 6 of the 12 calendar months (Jan, Apr, Jun, Sep, Nov, Dec). But what really stood out to me was AAPL's average outperformance in July and August, back-to-back months in the middle of summer! By adding the average outperformance of all 12 months,
you come up with average outperformance of AAPL of 17.2 percentage points. July and August alone account for 11.8 percentage points of outperformance. That inspired me to do more research on those two months and I found that AAPL had the following annualized returns by period:
June 28th through July 20th (Q3 pre-earnings run): +75.87%
August 25th through August 31st: +94.31%
I went back and looked at that June 28-July 20 period each year for the past two decades and AAPL was flat or had a significant rise during this period in all but 2 years. It's an amazing time of the year to ride a pre-earnings run and it's almost like clockwork.
Let me be clear. I typically do not use seasonal patterns as my primary indicator to trade. I generally use it as a secondary indicator. However, there are times when the patterns are too strong to ignore and I believe the summertime pattern for AAPL is one of them.