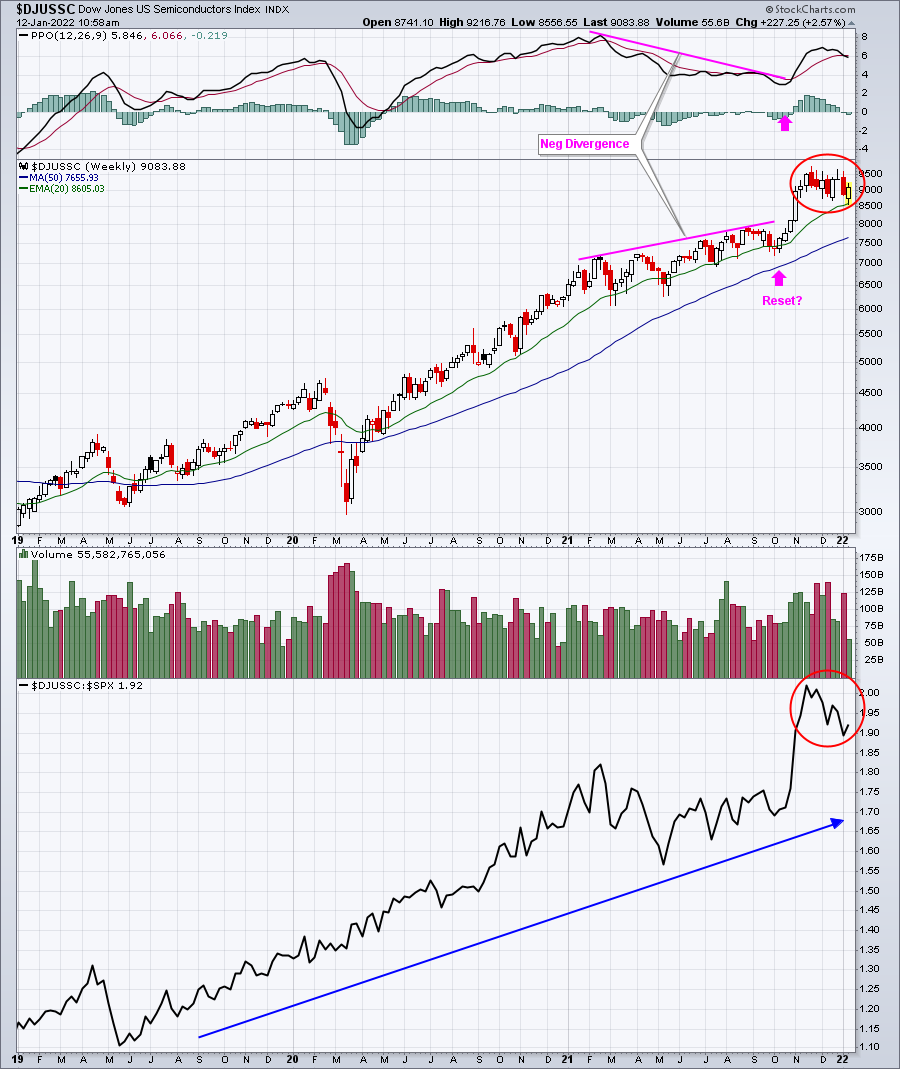
The long-term weekly chart above is still "up in the air", in my opinion. There was a negative divergence throughout 2021. Did the weakness in September do enough to qualify as a "reset" of momentum? Or do we still have a negative divergence? I'm not sure, but the absolute and
relative congestion (red circles) on the chart at least raise some doubt. I believe the next big move on the DJUSSC - either a breakout to the upside or breakdown to the downside - will be the most important signal that we'll receive. Could we see our first 50-week SMA test since April 2020? If so, then it would argue for a very weak period ahead.
An ETF that tracks many of the large cap semiconductor names is the iShares Semiconductor ETF (SOXX). Of all the ETFs in the universe, this is the one I'd follow most closely. It tracks the DJUSSC quite closely and if growth stocks move, we'll know it from this
ETF.
Later today, at 5:30pm ET, we're hosting an ETF Analyzer session to help provide us more knowledge about semiconductor ETFs and others in order to make more informed investing and trading decisions. It's a free event, so I hope you'll be able to
join!